01
Registered Global Network
Projected Nomadic Traders, enterprises, institutions and service providers.
The TBP Integrated Multi-Asset Simulator demonstrates how office towers, multi-tower complexes and underutilised institutional assets can be repositioned as continuously activated Nomadic Trading Places—combining global demand, vertical throughput, Corridor Trust services, operating income and priority asset-owner returns.
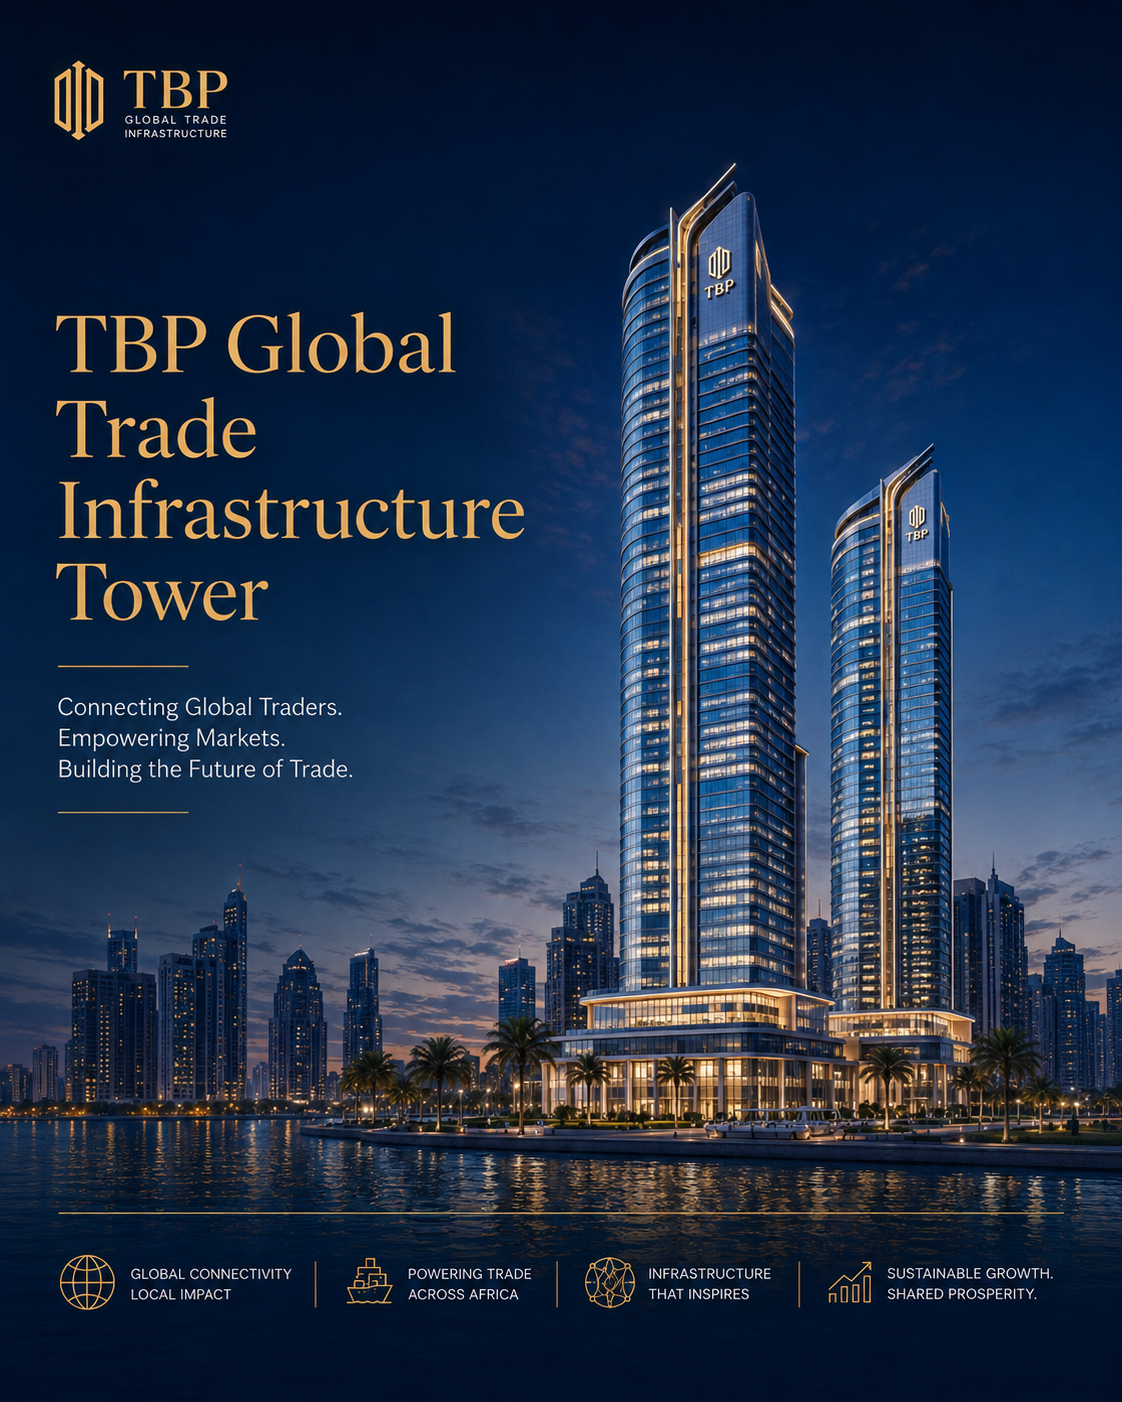
The simulator links the TBP Nomadic Trader demand concept with the physical, digital, institutional and financial layers required to operate a building as Global Trade Infrastructure.
Projected Nomadic Traders, enterprises, institutions and service providers.
Demand is routed towards the country, corridor and tower offering the relevant opportunity.
Trade floors, exhibitions, workspaces, deal rooms, sovereign suites and hospitality are repeatedly activated.
KYC, compliance, documentation, financial visibility and partner services support secure participation.
Hourly, daily, weekly, event, institutional, digital and service revenues are combined.
Operating costs and reserves are recognised before priority asset-owner distributions and upside sharing.
TBP performance is compared with vacancy, lease-up, incentives, fit-out, void costs and conventional cash flow.

The platform moves beyond a static rent-per-square-foot assessment and allows stakeholders to test a more active operating and commercial model.
Test registered-network size, annual activation, corridor allocation, tower capture, repeat visits and average stay.
Model floor allocation, adjacencies, circulation, capacities, utilisation, service cycles and demand exceeding capacity to support architects and designers in improving the operating design.
Assess KYC, financial visibility, documentation, trade readiness, partner participation and recurring trust-service income.
Calculate gross receipts, direct operating costs, shared building costs, maintenance reserves and distributable income.
Compare TBP with conventional vacancy, absorption, rent-free incentives, landlord fit-out, service leakage and finance carry.
Identify stronger floor uses, service mixes, prices, participation levels, cost efficiencies and stakeholder distributions.
The TBP Nomadic Trader is a verified commercial operator who can activate temporarily across connected corridors and nodes while retaining access to identity, compliance, workspace, trade, finance and professional-service layers.
The simulator converts that strategic proposition into transparent and adjustable assumptions. Registered demand is not treated as guaranteed occupancy; it is filtered through activation, corridor relevance, node capture, capacity and service uptake.
Each profile has its own functional architecture and illustrative assumptions, while remaining within the same network-demand, Corridor Trust, revenue, lease-reality and priority-return framework.
Flagship vertical Nomadic Trading Place for trade, trust, sovereign participation, institutions and global business activation.
Canary Wharf profileLower Manhattan Global Trade Infrastructure tower connecting capital, trade services, institutions and global market access.
Wall Street profileArchipelago commodities and coordination in Jakarta; Islamic capital, halal trade and advanced industry in Kuala Lumpur.
Two specialised gatewaysGlobal capital and Trust intelligence; mainland logistics and EEC trade; Pacific digital services and global talent.
Three specialised gatewaysMulti-tower trade exhibitions, outlets, co-working, Corridor Trust, hospitality, serviced stay and community activation.
Connected cluster profileTest another office tower, multi-tower complex, institutional building or future TBP Global Trade Infrastructure node.
Editable custom profileTest the level of distributable income required to replace conventional rent and create additional owner upside.
Owner-first waterfallAssess the time and cost of rebuilding occupancy rather than comparing TBP only with a former tenant's headline rent.
Ten-year comparisonThe simulator provides a common analytical language for owners, managers, investors, capital partners, architects, designers, TBP and specialist operators.
Assess the pathway from vacancy or conventional income towards priority distributions and commercial upside.
Move from passive occupancy management to continuous floor, service and capacity optimisation.
Use operational simulation to optimise how people, services and commercial activities move through the building before detailed design is fixed.
Review demand, revenue composition, stabilisation, cash flow and comparative property economics.
The landing portal now gives visitors access to two connected TBP tools: one focused on asset economics and commercial returns, and the other focused on vertical tower flow, capacity, floor zones and live operational activation.
Focused on revenue, lease reality, earnings optimisation, priority owner return and comparative performance across multiple asset profiles.
Focused on participant flows, process capacity, floor-zone architecture, editable operational inputs and live building-throughput behaviour—helping architects and designers test and improve design flow before detailed development.
Together, the two simulators explain both sides of the proposition: how the asset performs commercially and how it operates physically as TBP Global Trade Infrastructure.
Open the animated editable flow and floor-zone edition to explore how a vertical TBP trade tower performs operationally. Test participant demand, arrival and KYC throughput, live operating inputs, floor-zone architecture, process capacity and animated tower activity in the browser. The tool also supports architects and designers in optimising circulation, adjacencies, floor allocation, access, shared-space capacity and overall design flow.
Tower Simulator™ • Animated Editable Flow & Floor-Zone Edition